According to the author:
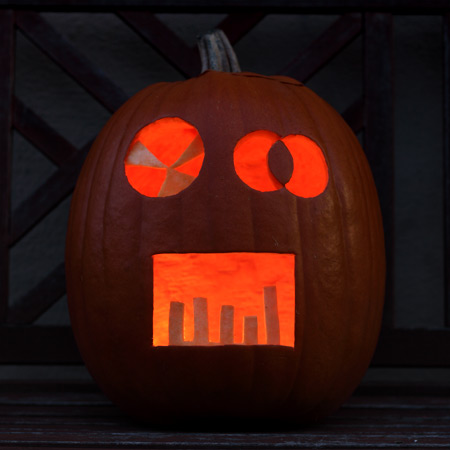
The Graph-O’-Lantern – 6% pie, 5% Venn, 13% bar, and 100% gourd!
The description of each chart, clockwise from the upper-left:
- Typical Witches’ Brew Composition By Weight (pie chart)
- Known Scare Tactics Of Ghosts And Zombies (Venn diagram)
- Vampire-Related Deaths Per Decade, Transylvania, 1960-2009 (bar graph)


0 comments:
Post a Comment
Comments and Feedback? Love that stuff. Please leave your thoughts in the box below--